
It is once again time for my most popular blog post of the year. In this blog post, I will attempt to answer the question:
“What are my chances of receiving an offer of admission to an undergraduate engineering program at the University of Waterloo?”
As I have pointed out in previous years, this is never an easy question to answer since every applicant is different. For the purpose of selecting applicants that are likely to succeed in our undergraduate engineering programs, grades remain the most important consideration. Excellent grades in high school can be a strong indicator of future success in university. However, grades should not be the only consideration.
Our admissions process examines many other factors when selecting our applicants. We require all applicants to complete an admission information form which we use to assess skills, employment experience, volunteer service, course work, extracurricular activities, and notable achievements. We also strongly recommend that all applicants complete an online interview. While the interview process is optional for the purpose of admission consideration, it is a requirement for entrance scholarship consideration. Through the admission information form and the online interview, we are able to better understand the qualifications of an applicant and the challenges faced by the applicant. Our assessments also help us gauge an applicant’s level of interest in our programs and an applicant’s level of fit for our programs.
We assess all applicants that meet our minimum entrance grade requirements. For our engineering programs, applicants are required to have an admission average of 85% with no grades lower than 70% in any of our required courses in their final year of high school. In this sense, grades qualify an applicant for admission. We then use a combination of the admission average with our other assessment tools to individually select applicants. Students with higher admission averages are more likely to be selected for admission but they are not guaranteed to be selected for admission. The admission information form and the online interview give applicants with lower grades a chance to compete for coveted spaces in our engineering programs.
Using the Ontario Secondary School applicant data for the Fall 2021 admission cycle, I have produced two graphs that show the probability of an Ontario Secondary School (OSS) applicant receiving an offer of admission to undergraduate engineering programs at the University of Waterloo. I have grouped our engineering programs as follows:
- Biomedical and Software
- Computer, Electrical, Mechanical, Mechatronics, and Systems Design
- Architectural, Chemical, Civil, Environmental, Geological, Management, and Nanotechnology
These groupings are the same as the previous three admission cycles. Clearly, not all programs grouped together have exactly the same admission offer probabilities. I did consider alternative groupings. My analysis of individual program data showed that the programs in these groupings continue to behave similarly.
The first graph summarizes the probability of an admission offer for Canadians and permanent residents applying from the Ontario Secondary School system given a particular admission average. The vertical axis represents the admission probability and the horizontal axis represents an applicant’s admission average. The admission average is calculated using the grades reported by OUAC. It has not been adjusted in any way.
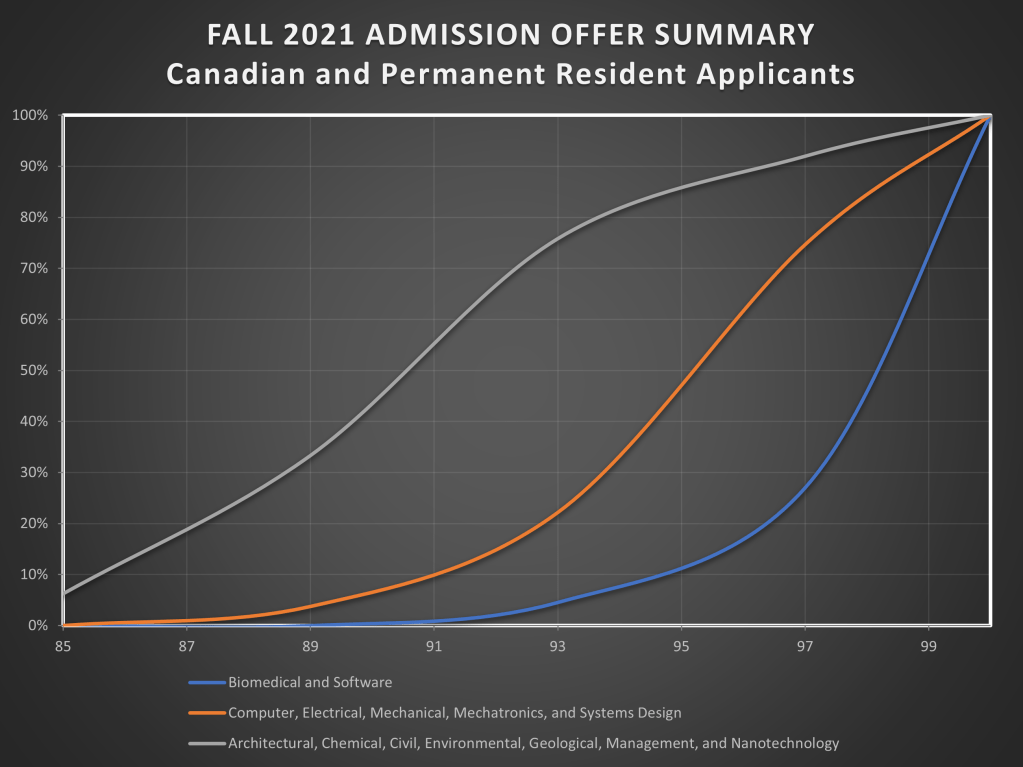
While the graph resembles the one from last year, there are two noticeable differences. First, the admission averages are slightly higher. While some might quickly argue that this is compelling evidence of grade inflation, it is important to note that we also had a record number of applicants to our undergraduate engineering programs last year. Second, the shape of the curve for Architectural, Chemical, Civil, Environmental, Geological, Management, and Nanotechnology is different. Due to the fact that admission averages shifted upwards, the slope of the curve is steeper. While it is still possible for applicants with averages between 85% to 90% to be admitted to our undergraduate engineering programs, applicants have a much higher probability of success with an average of 90% or greater. It is not clear if this trend will continue into the next admission cycle.
The second graph summarizes the probability of an admission offer for visa students applying from the Ontario Secondary School system given a particular admission average. The vertical axis represents the admission probability and the horizontal axis represents an applicant’s admission average. The admission average is calculated using the grades reported by OUAC. It has not been adjusted in any way.
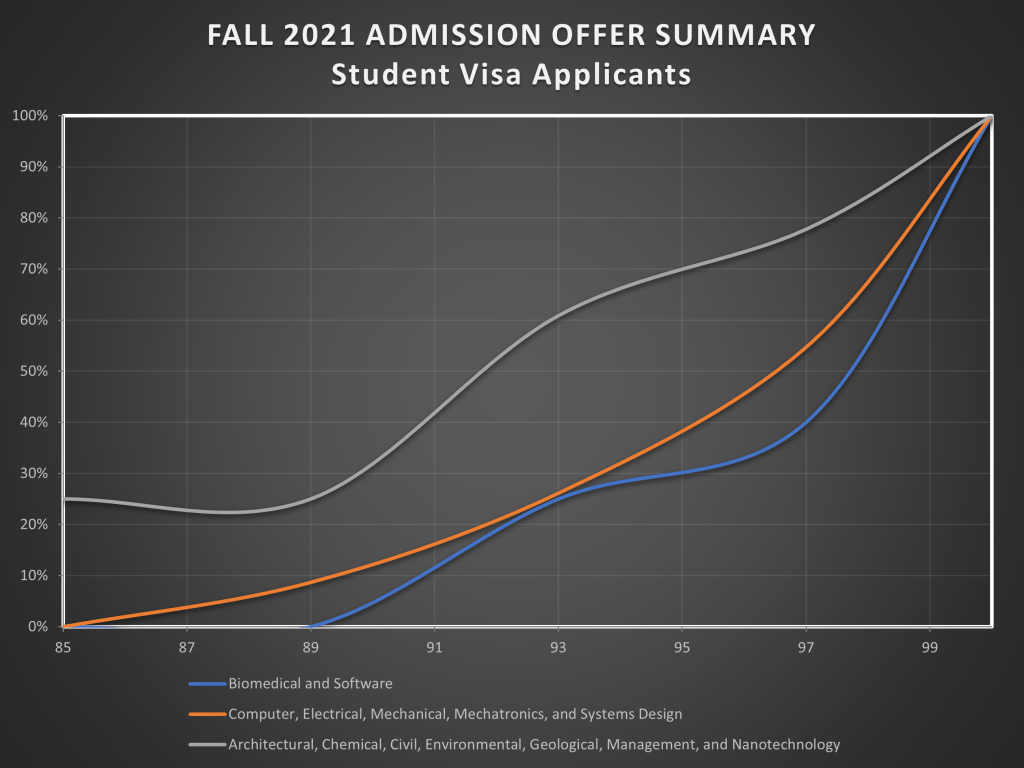
This graph is noisy due to the small sample size. The data appears to suggest that an applicant to Civil Engineering with an 85% admission average has a higher probability of success than an applicant with an 88% admission average. In general, one should assume that admission probabilities increase as admission averages increase. Overall, the admission offer probabilities for visa students increased again this past year. Visa students compete for a small number of reserved spaces in our programs. Due to the global pandemic, there were fewer qualified visa applicants. I expect this trend to continue into the foreseeable future as demand for qualified visa students at Canadian universities continues to outpace the supply of qualified visa students.
I used a slightly different approach from the one I used last year to produce these graphs. I used the built-in curve fitting of Microsoft Excel. This approach should allow me to produce comparable graphs next year in less time.
It is important to remember that these graphs may not accurately predict the Fall 2022 admission cycle. There are many questions that are difficult to answer this year:
- Will applicant numbers continue to remain strong?
- Will admission targets remain the same as last year?
- Will the pandemic cause applicants to reconsider pursuing a university education?
Applicants should not attempt to not read too much into the admission probability graphs. The data can be scary if you don’t fully understand it. Some applicants did not complete the required admission information form or attempt the optional interview. Some applicants to Software Engineering were not admitted for not having any evidence of structured programming experience. Some applicants withdrew their application for admission prior to an offer being granted. If I eliminated applicants with incomplete applications or withdrawn applications from the data set, the admission probabilities would improve dramatically.
Our recruiting cycle for Fall 2022 has now begun. You might wish to attend the upcoming Ontario Universities’ Fair to learn more about the University of Waterloo and its programs. The Faculty of Engineering is hosting its popular Undergraduate Admissions Webinar Series again this year. Prospective applicants may also book Campus Tours to learn more about our campus or connect with an existing student by registering for a virtual EngChat.
